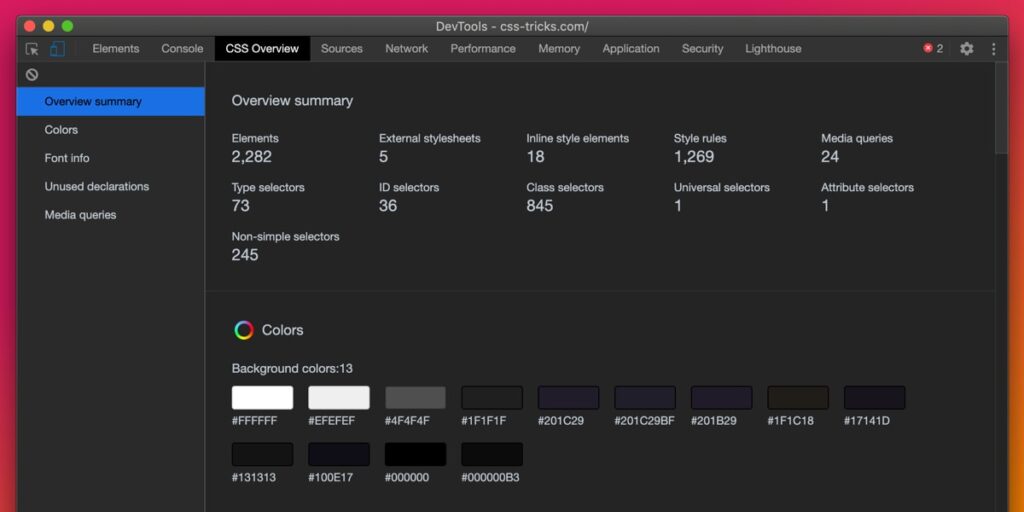
It includes detailed information about colors, fonts, media queries, and unused declarations. This feature comes in handy when you make CSS modifications to the UI, and you don’t need to use 3rd party tools like color picker anymore.
How to enable this feature?
On Google Chrome, click View -> Developer -> Developer Tools.
Open Settings
Click on Experiments Tab.
Enable the CSS Overview.
A new tab will appear in DevTools as CSS Overview.
Even though this CSS Overview panel is an experimental feature, you will never turn it off once you use it. This feature is incredibly helpful and makes your CSS work a lot easier.
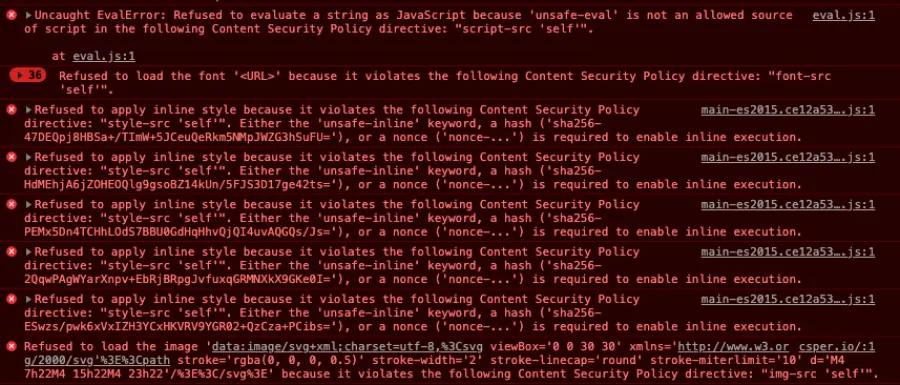
CSP Violations
Enabling this feature will add an extra layer of security to your application and reduce the vulnerabilities such as Cross-Site Scripting (XSS).
How to enable this feature?
Even though this CSS Overview panel is an experimental feature, you will never turn it off once you use it. This feature is incredibly helpful and makes your CSS work a lot easier.
Close the DevTools window and open it again.
Go to Experiments Tab through Chrome Developer Tools.
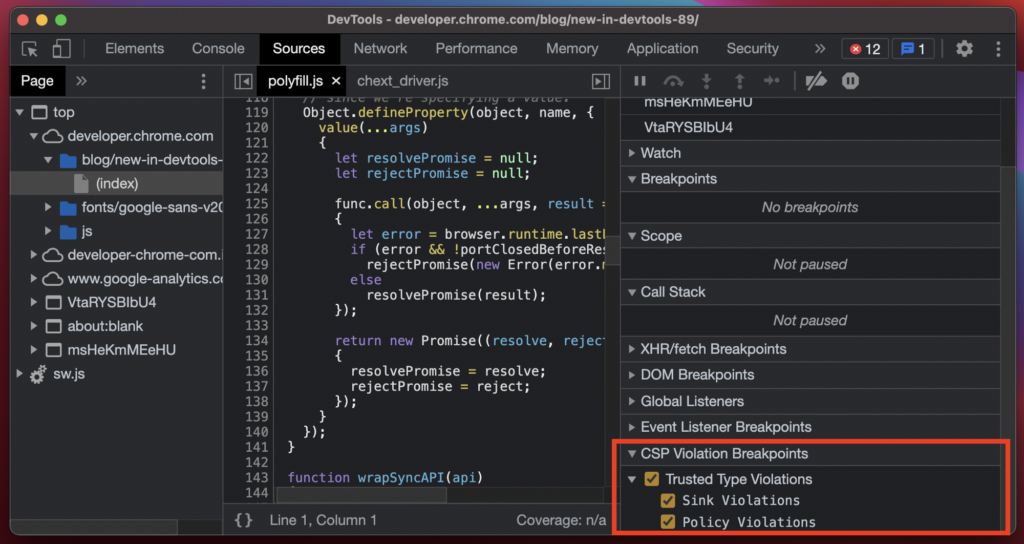
Under CSP Violations Breakpoints, check Trusted Type Violations and violation types to activate the feature.
Check the Show CSP Violations view option.
Chrome DevTools even shows the additional details on fixing them, just in front of the detected vulnerable code block.
New Font Editor Tools
Chrome DevTools provide an experimental font editor tool that can be used to change font settings. You can change the font family, sizes, weight, height spaces using it and see the changes in real-time.
How to enable this feature?
Go to Experiments Tab through Chrome DevTools.
Check Enable New Font Editor Tools within Styles Pane.
Close the DevTools window and open it again.
Select the HTML element, which includes the font properties you want to change.
Then, you will notice the Font Editor icon in the Styles pane.
Dual Screen Mode
This feature is a lifesaver when it comes to debugging dual-screen devices like surface Duo.
How to enable this feature?
Go to Experiments Tab through Chrome DevTools.
Check Emulation: Support dual-screen mode.
Close the DevTools window and open it again.
Open the web page you want to test via the Toggle Device Toolbar option on the top right corner of the DevTool window.
Switch the emulator to a Surface Duo device (or another available foldable device).
Then click the Toggle dual-screen mode to emulate your web application in dual-screen mode.
Full Accessibility Tree View
This feature is a bit familiar to Inspect Elements tab. But it allows you to dig deep down and explore more accessibility details of your web application.
How to enable this feature?
Go to Experiments Tab through Chrome DevTools.
Check the Full accessibility tree view in the Elements pane.
Close the DevTools window and open it again.
Switch Elements view mode to Full Accessibility Tree View by clicking the new accessibility button shown in the Elements panel.
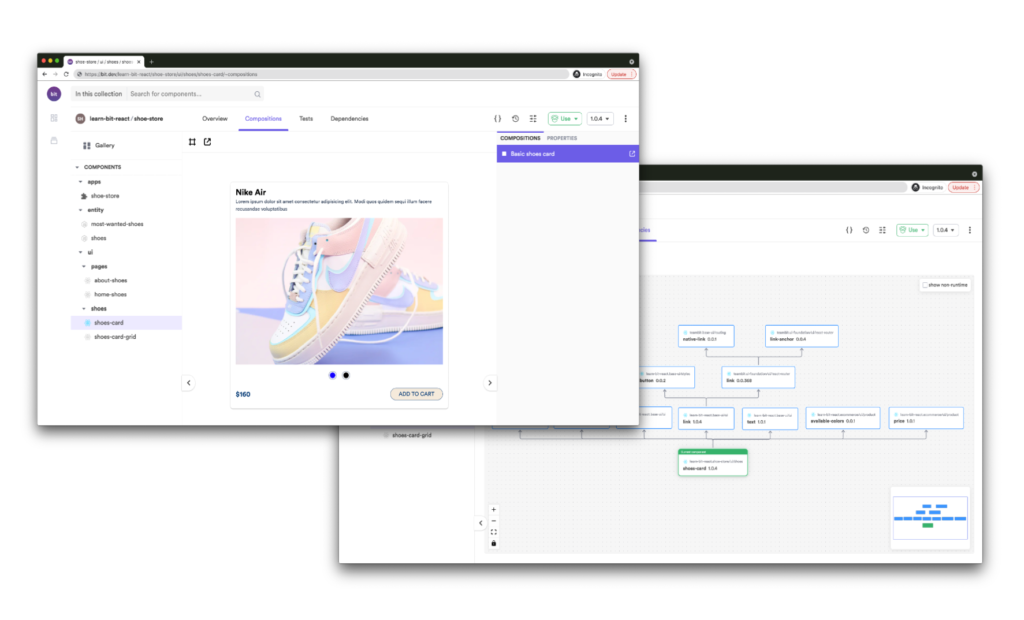
Build with independent components, for speed and scale
Instead of building monolithic apps, build independent components first and compose them into features and applications. It makes development faster and helps teams build more consistent and scalable applications.
OSS Tools like Bit offer a great developer experience for building independent components and composing applications. Many teams start by building their Design Systems or Micro Frontends, through independent components.
Conclusion
In this article, I discussed 5 powerful yet uncommon Chrome DevTools experimental features. Out of five, how many features did you know earlier? Post your thoughts below.
I hope this might help you to make your developer life easier with Chrome DevTools. Thanks for reading!